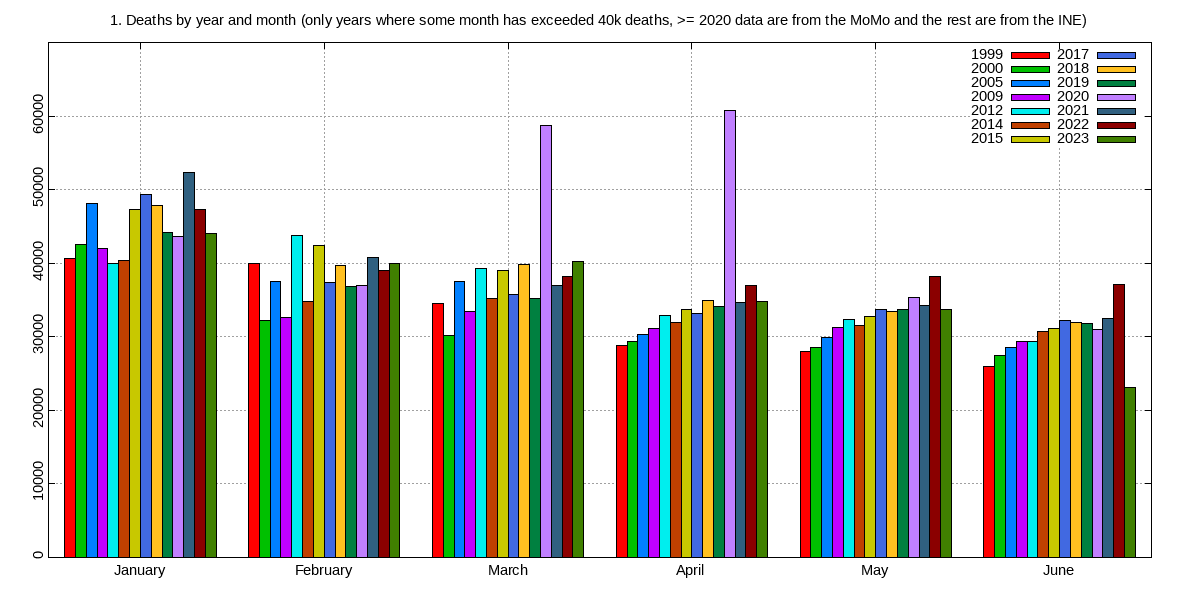
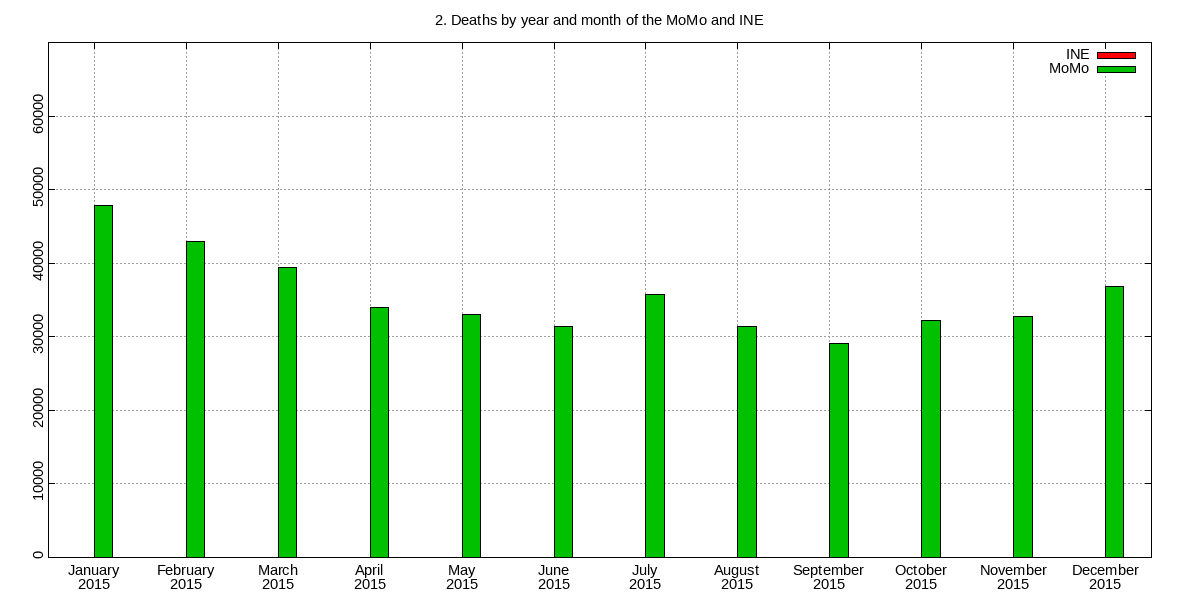
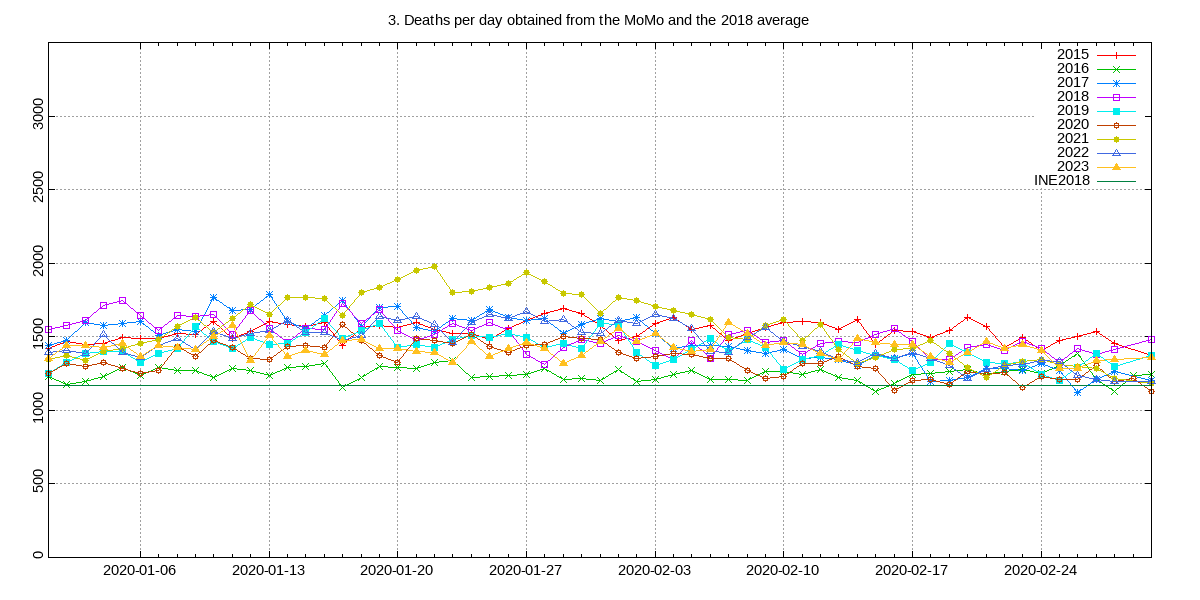
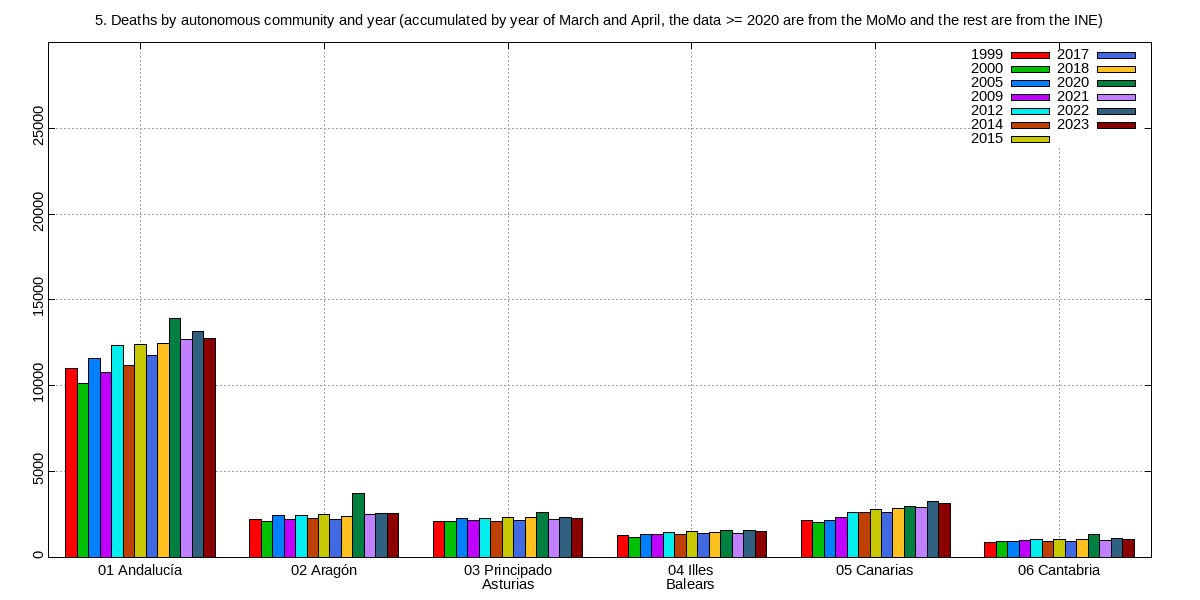
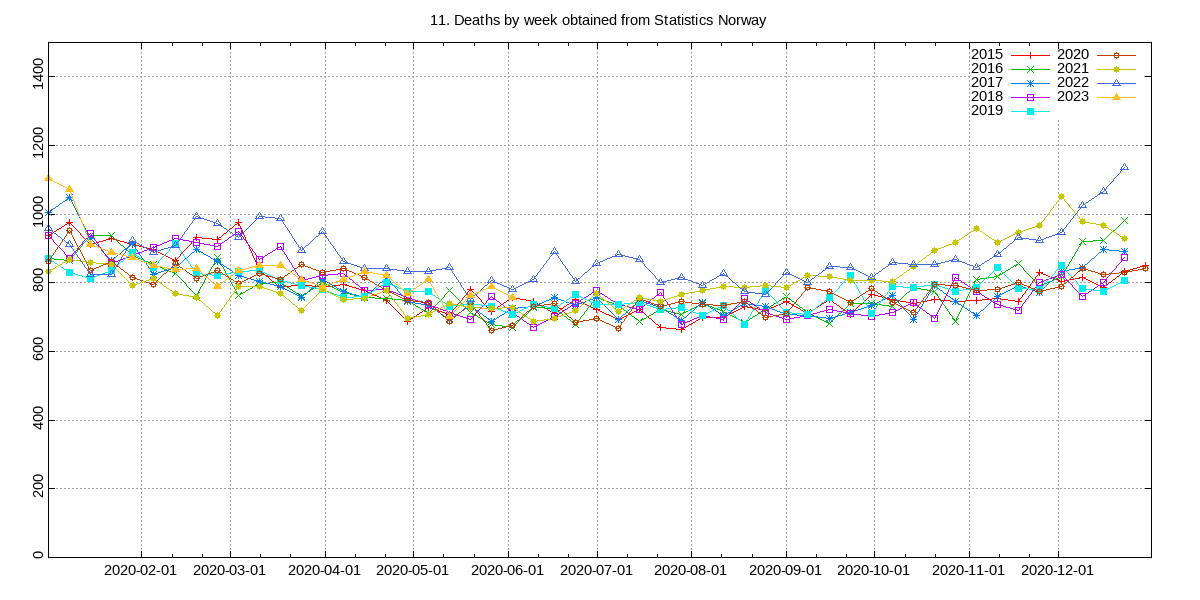
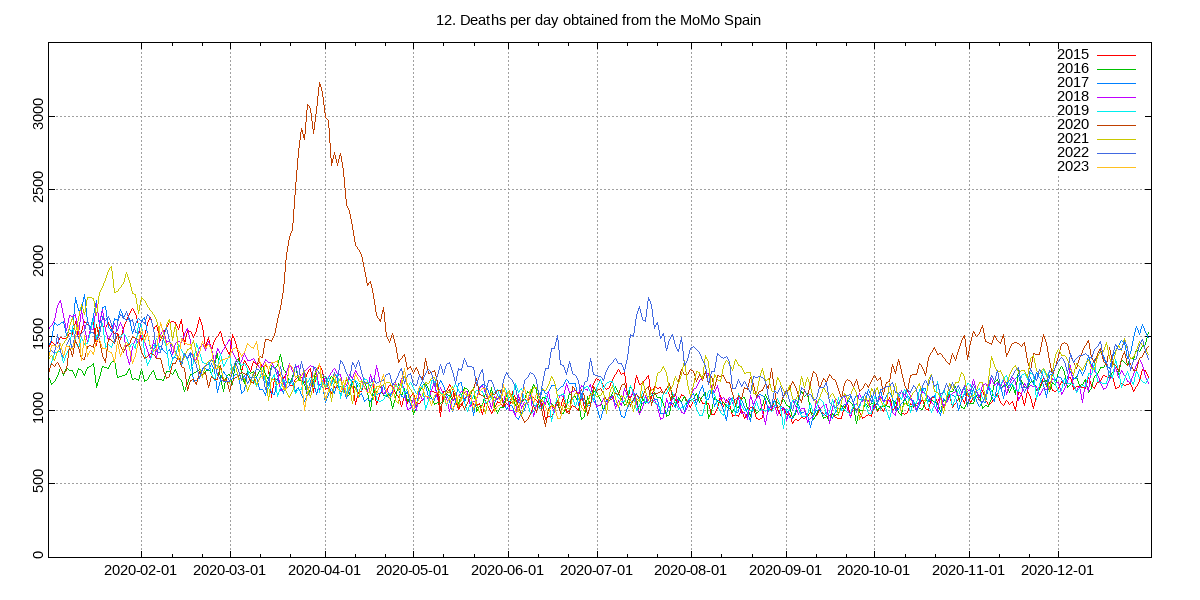
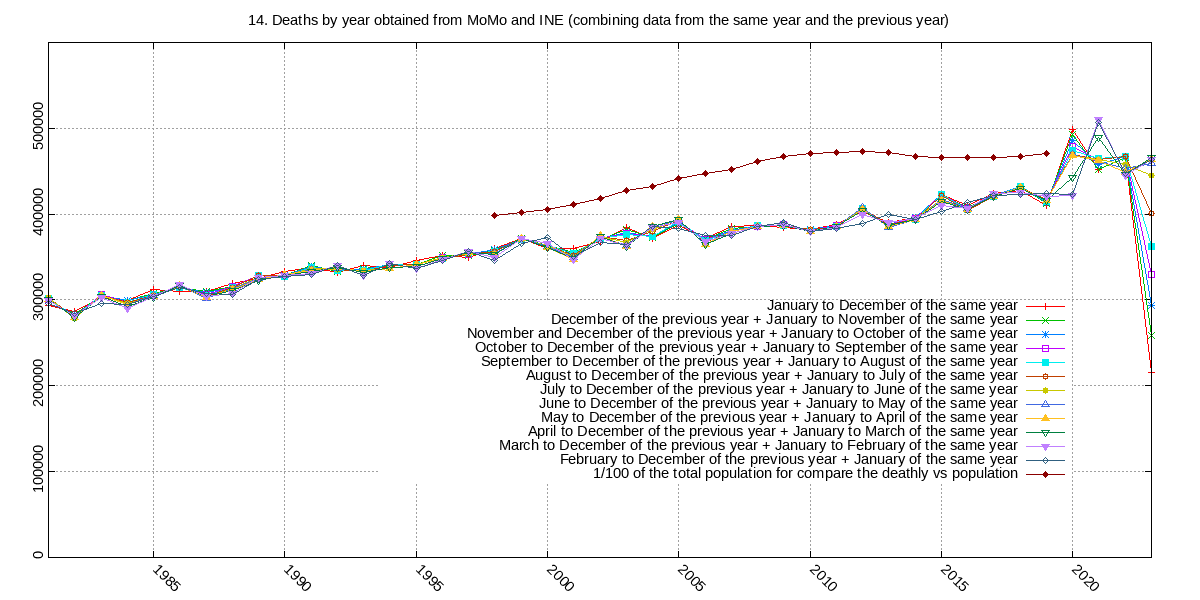
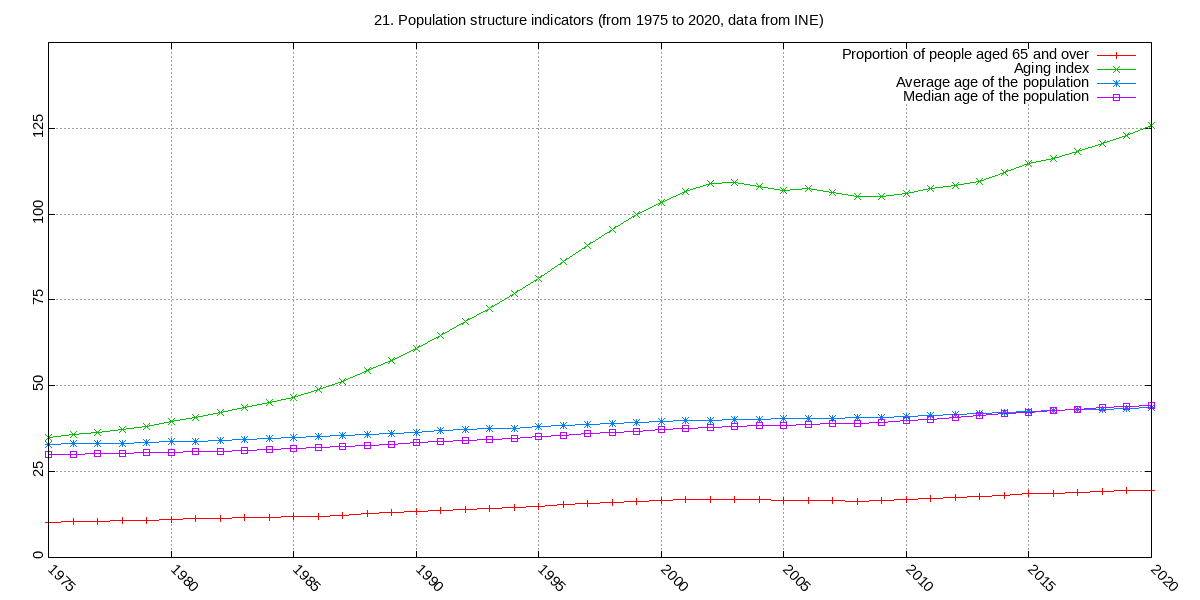
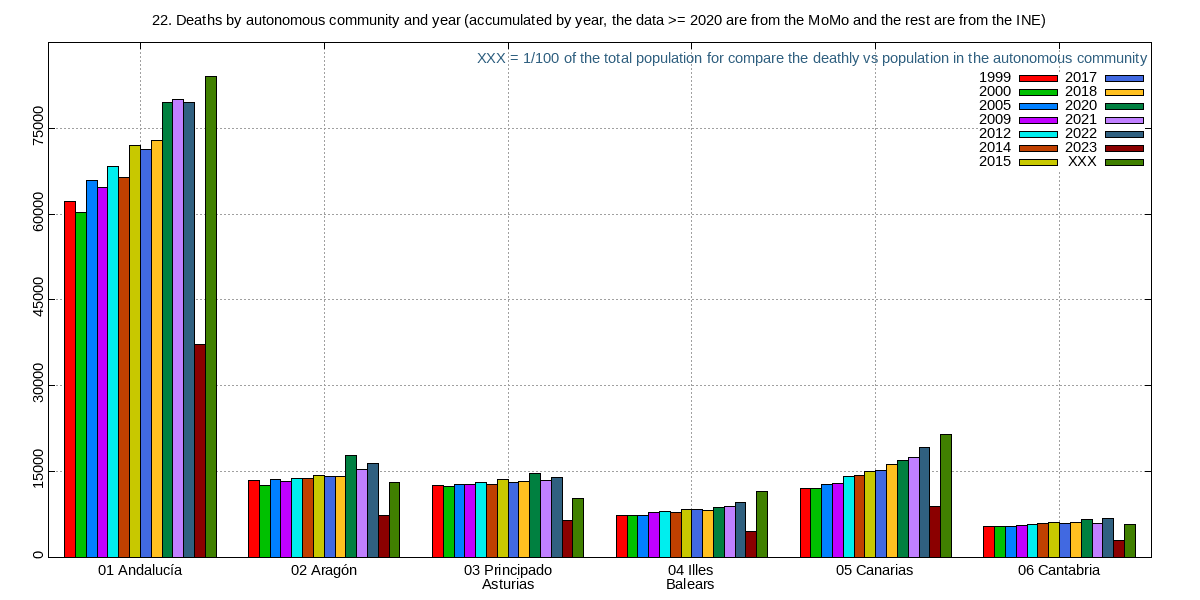
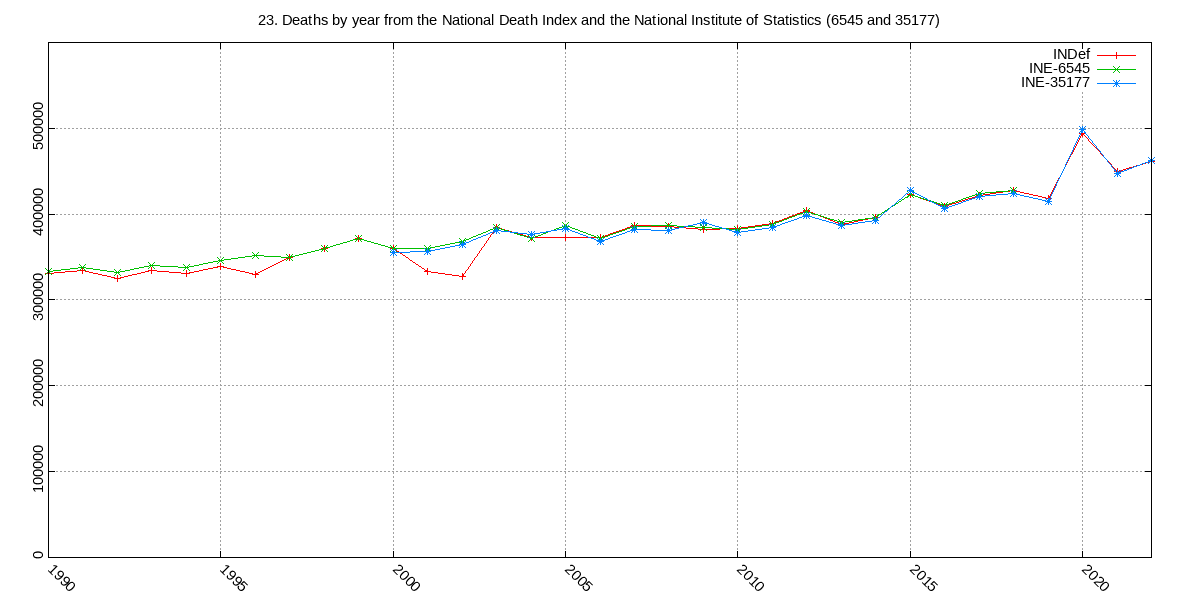
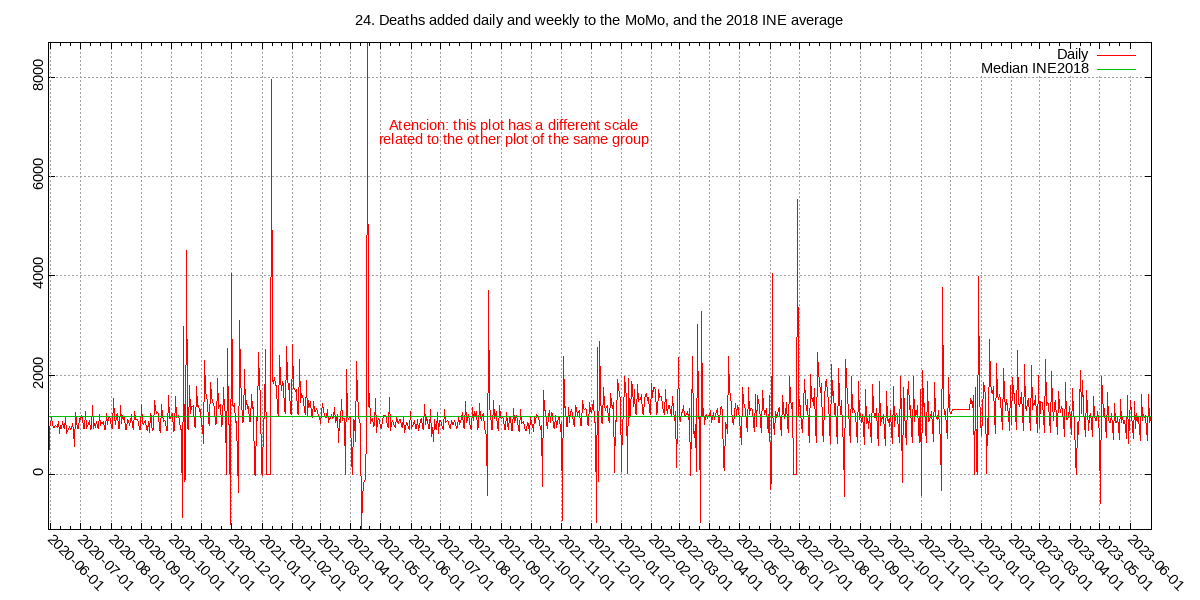
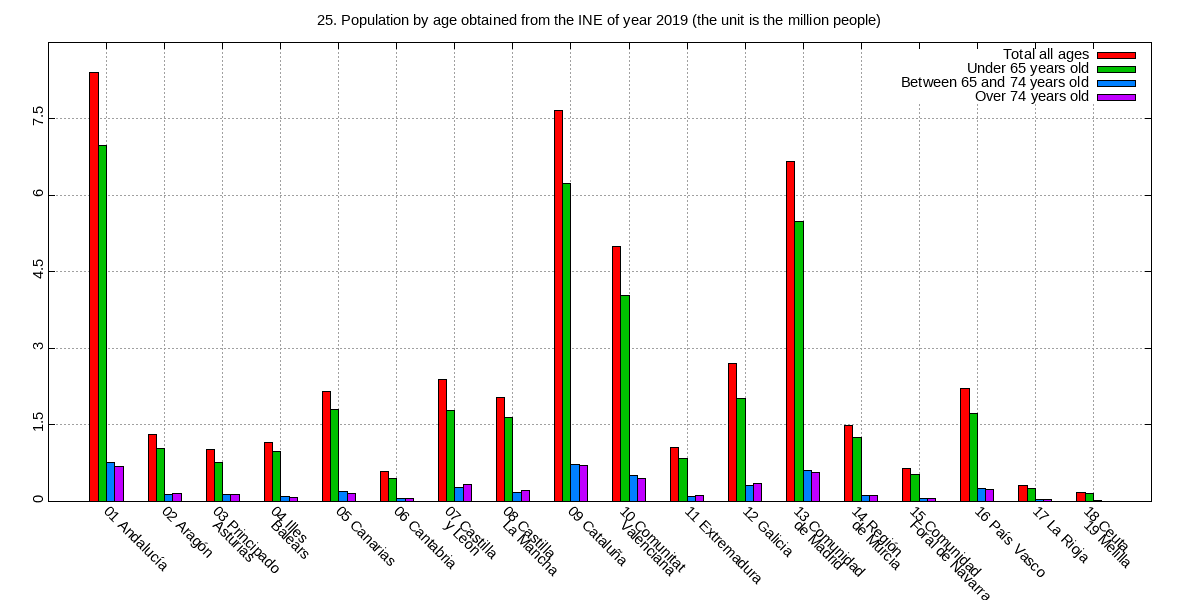
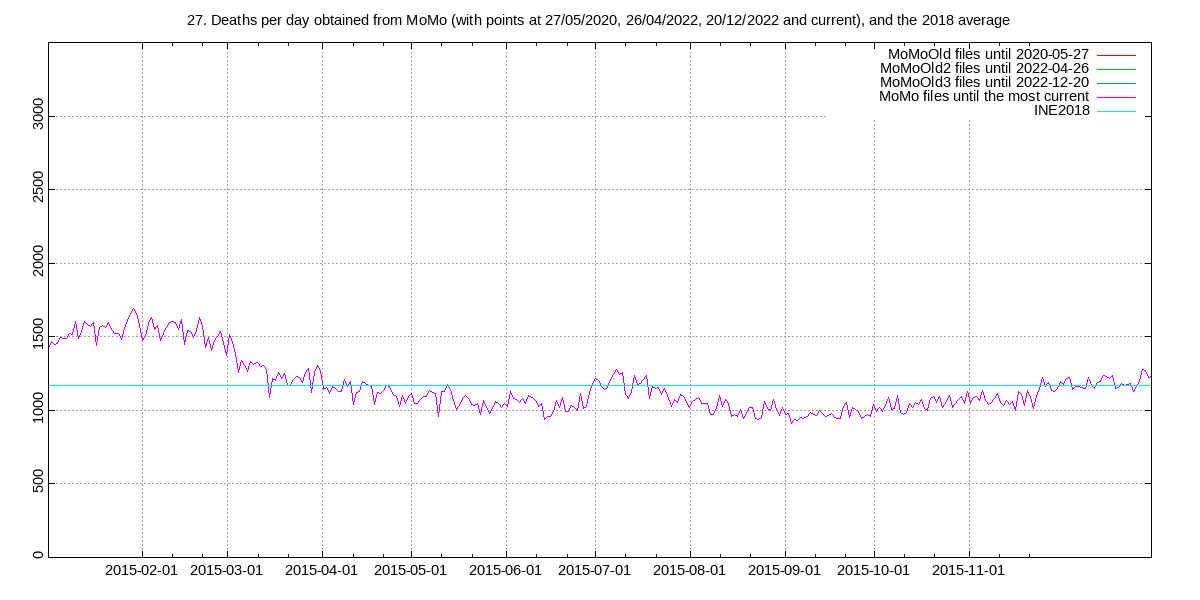
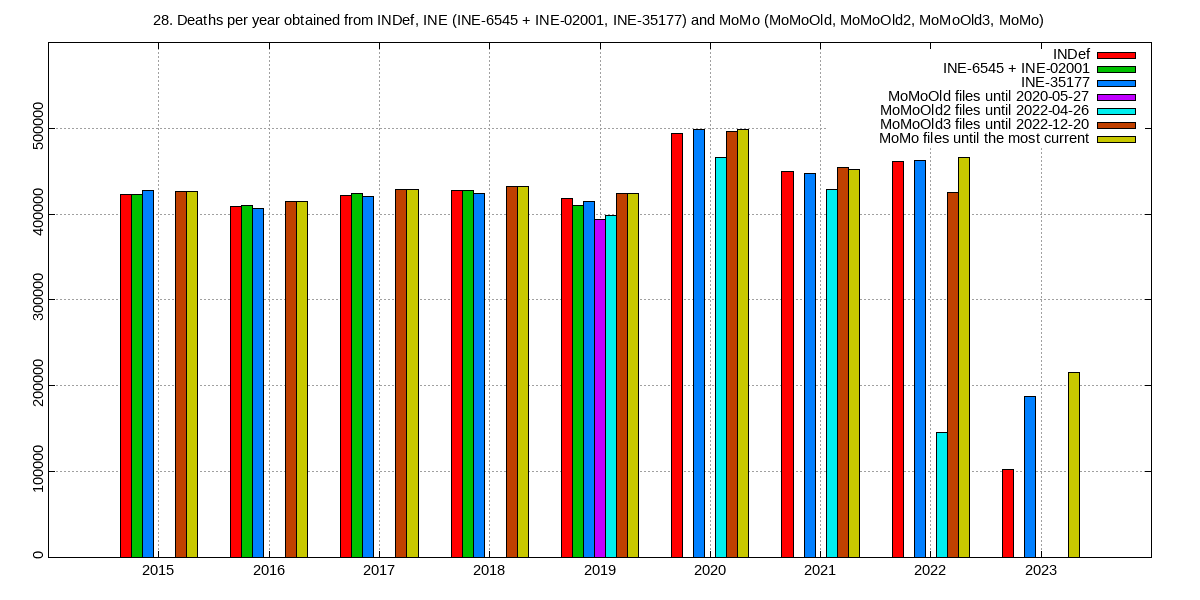
Graphs of deaths by year, origin of the data, daily accumulated, weekly, montly, yearly, by age, by autonomous community, by province, by country and more

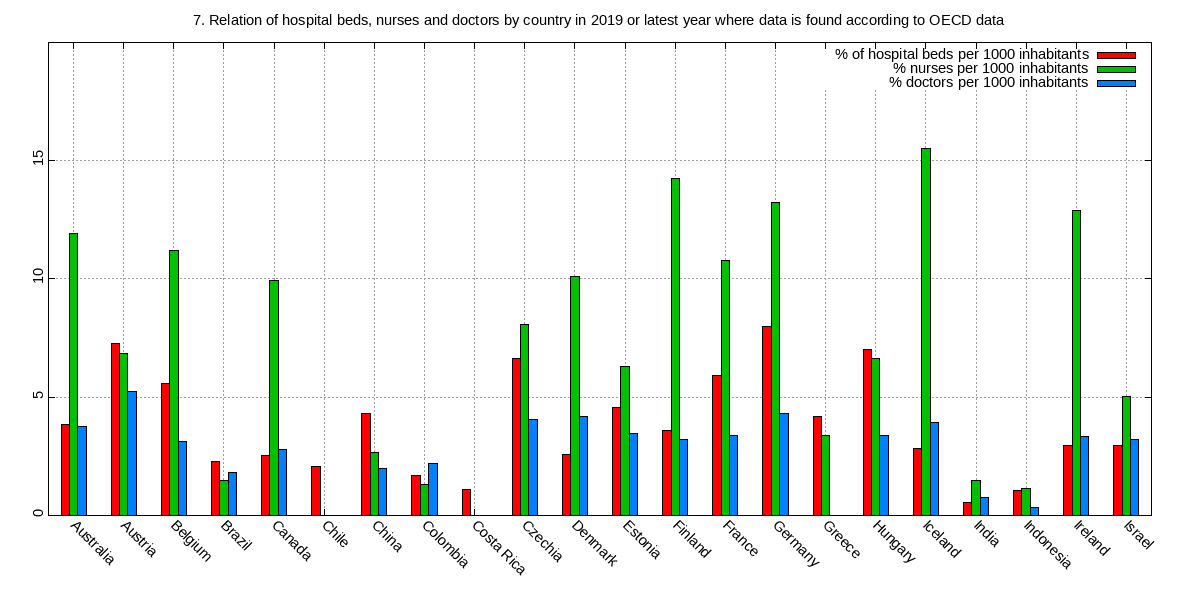
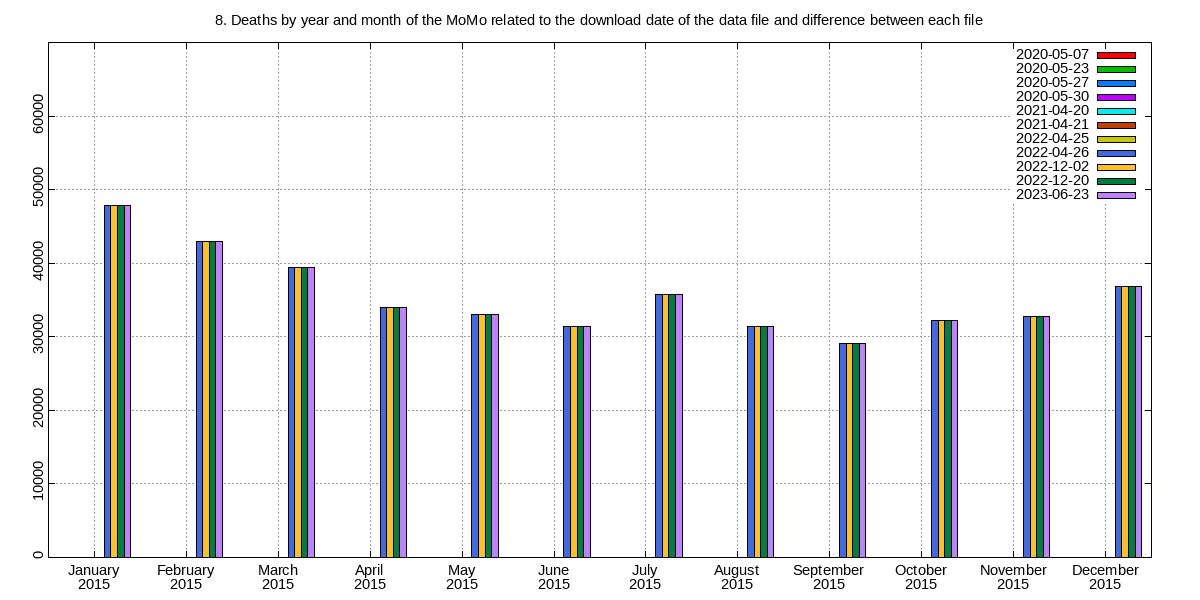
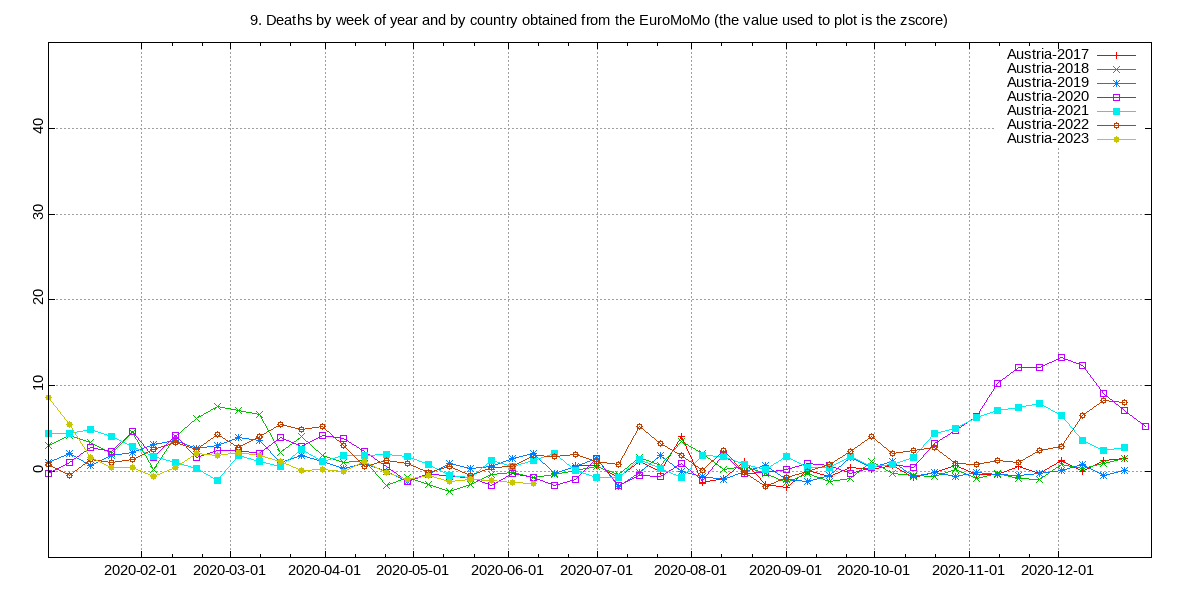
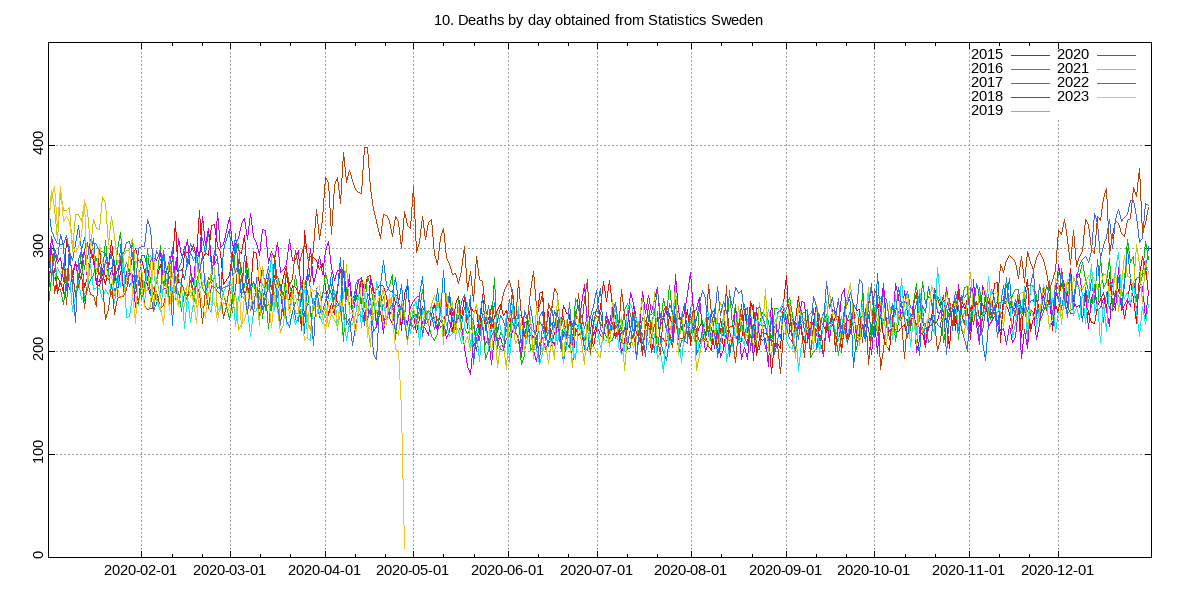
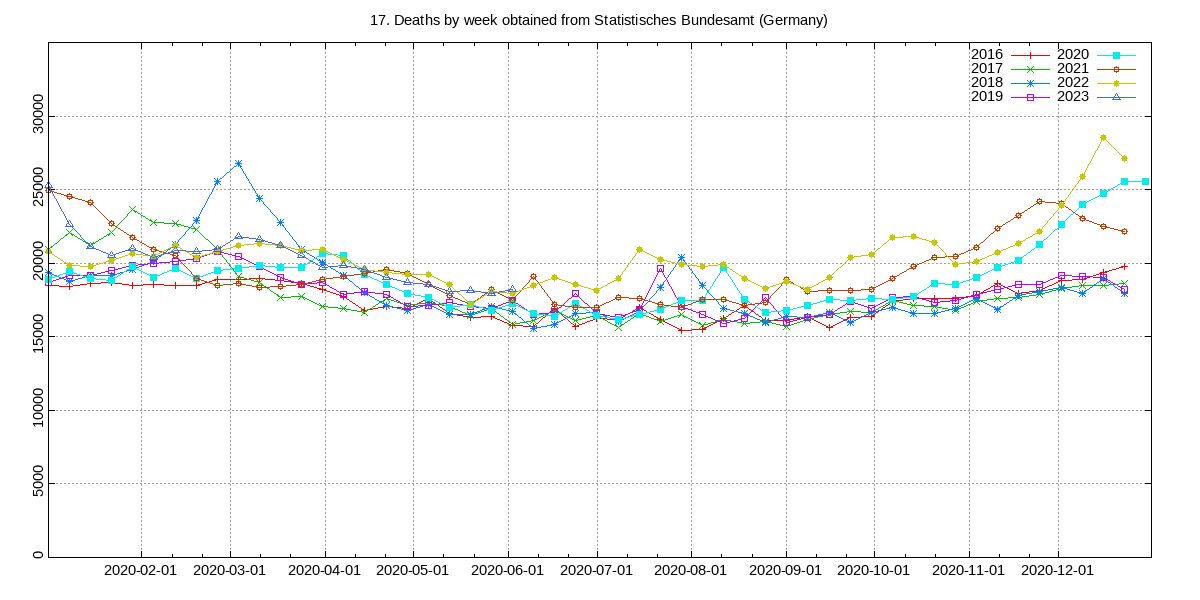
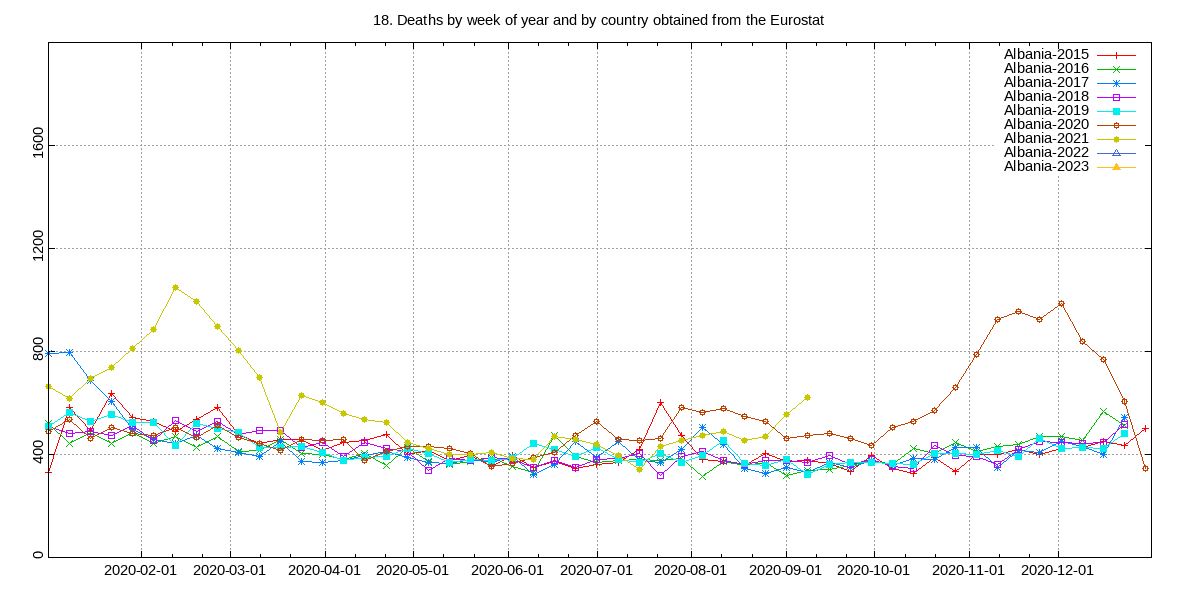
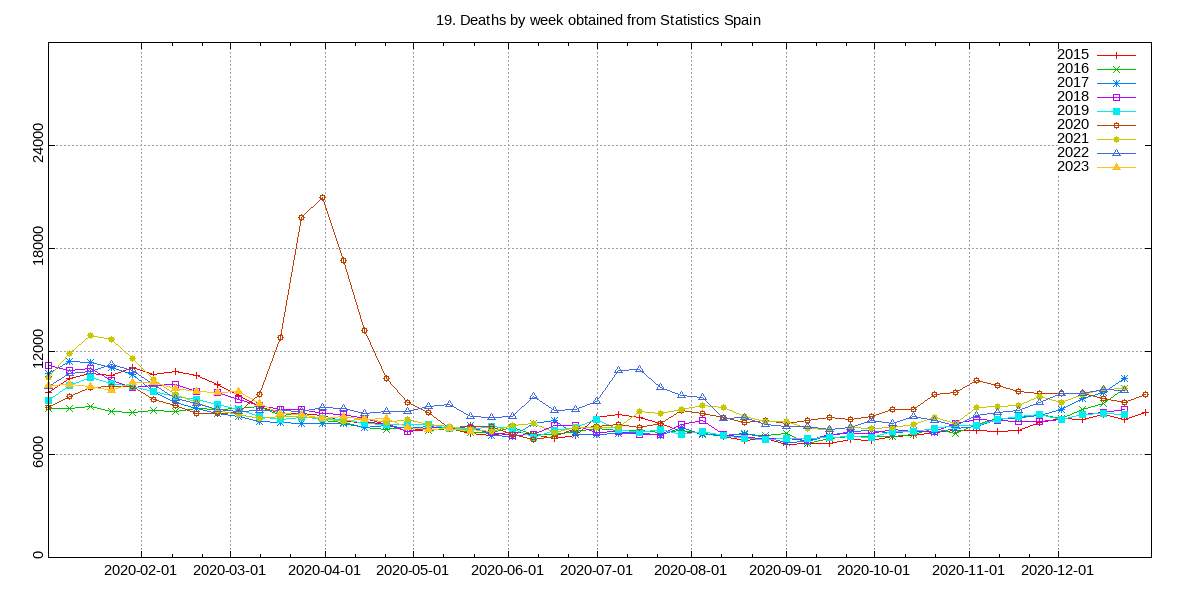
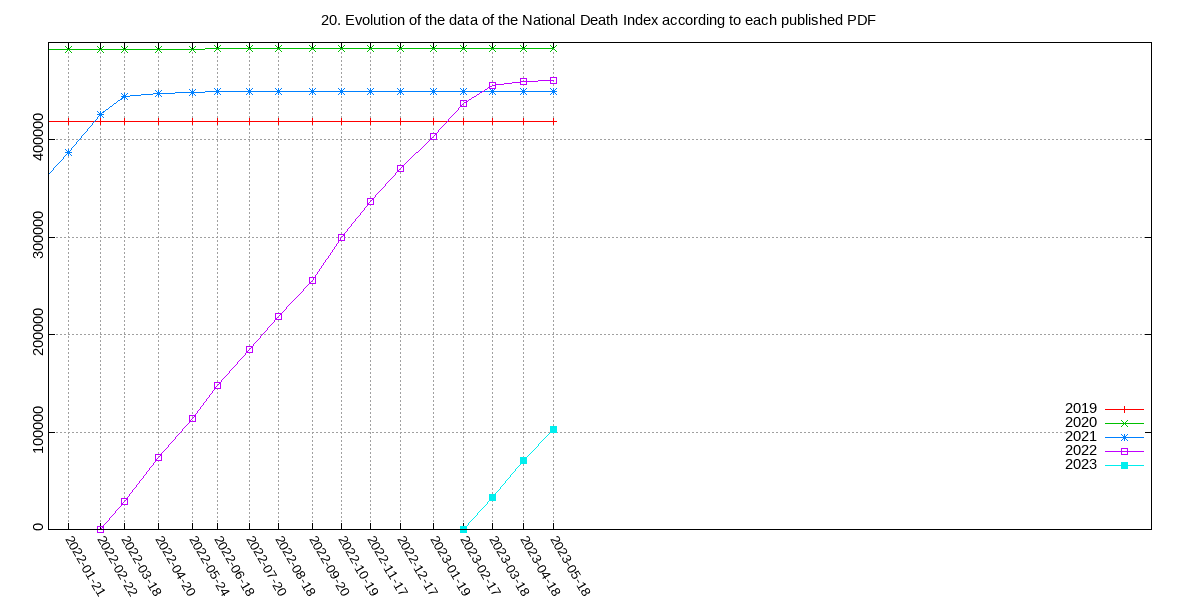
All data have been obtained from official sources as MoMo, INE, CSIC, OECD, EuroMoMo, Eurostat, or the equivalents to the National Statistics Institute of Sweden, Norway, Portugal, France and Germany

1. Deaths by year and month (only years where some month has exceeded 40k deaths, >= 2020 data are from the MoMo and the rest are from the INE)

2 images

2. Deaths by year and month of the MoMo and INE

9 images

3. Deaths per day obtained from the MoMo and the 2018 average

6 images

4. Deaths by year, month and age (>= 2020 data are from MoMo and the rest are from INE)

3 images

5. Deaths by autonomous community and year (accumulated by year of March and April, the data >= 2020 are from the MoMo and the rest are from the INE)

3 images

6. Places of residences by type and autonomous community (data obtained from envejecimientoenred.es, from the CSIC of 2019)

1 image

7. Relation of hospital beds, nurses and doctors by country in 2019 or latest year where data is found according to OECD data

2 images

8. Deaths by year and month of the MoMo related to the download date of the data file and difference between each file

15 images

9. Deaths by week of year and by country obtained from the EuroMoMo (the value used to plot is the zscore)

27 images

10. Deaths by day obtained from Statistics Sweden

1 image

11. Deaths by week obtained from Statistics Norway

1 image

12. Deaths per day obtained from the MoMo Spain

1 image

13. Deaths by day obtained from SICO Portugal

1 image

14. Deaths by year obtained from MoMo and INE (combining data from the same year and the previous year)

1 image

15. Evolution of the second wave deaths per day obtained from the MoMo by 2018, 2019, 2020 and the 2018 average

1 image

16. Deaths per day obtained from the Institut National de la statistique et des études économiques (France)

1 image

17. Deaths by week obtained from Statistisches Bundesamt (Germany)

1 image

18. Deaths by week of year and by country obtained from the Eurostat

39 images

19. Deaths by week obtained from Statistics Spain

1 image

20. Evolution of the data of the National Death Index according to each published PDF

4 images

21. Population structure indicators (from 1975 to 2020, data from INE)

1 image

22. Deaths by autonomous community and year (accumulated by year, the data >= 2020 are from the MoMo and the rest are from the INE)

3 images

23. Deaths by year from the National Death Index and the National Institute of Statistics (6545 and 35177)

1 image

24. Deaths added daily and weekly to the MoMo, and the 2018 INE average

2 images

25. Population by age obtained from the INE of year 2019 (the unit is the million people)

1 image

26. Number of difference lines between each MoMo file comparing all except the last 365 lines of data

1 image

27. Deaths per day obtained from MoMo (with points at 27/05/2020, 26/04/2022, 20/12/2022 and current), and the 2018 average

8 images

28. Deaths per year obtained from INDef, INE (INE-6545 + INE-02001, INE-35177) and MoMo (MoMoOld, MoMoOld2, MoMoOld3, MoMo)

1 image